# The Object-Oriented Approach with matplotlib
Up until now we've been using the very popular approach of having a "currently active figure" and "currently active axes" where we draw plots:
import matplotlib.pyplot as plt

plt.figure()
plt.plot([1, 2, 3, 4], [3, 5, 9, 25])
plt.show()
However, if you're developing a larger matplotlib application, rather than just small scripts and using it interactively, the object-oriented approach can help make your code more explicit.
This is what that same code looks like, using the object-oriented approach:
import matplotlib.pyplot as plt

figure = plt.figure()
axes = figure.add_subplot()
axes.plot([1, 2, 3, 4], [3, 5, 9, 25])
plt.show()
Now we're still using plt.figure(), but this time we're assigning its return value to a variable (a Figure object).
We're then using that object to interact with the figure. Here we're using add_subplot() to create a new space in the figure for our axes. It returns an Axes object, onto which we can plot our data using .plot().
At the end, we use the plt library to call .show().
In object-oriented code you'll sometimes see figure.show() instead, so what are the differences between plt.show() and figure.show()?
Since we're running this as a Python script, we want the graph to be displayed in its own window, with the appropriate controls to manipulate the graph and adjust its settings. We use plt.show() because it does all that for us.
However, if you wanted to embed the graph in a GUI application, a Jupyter notebook, or even the PyCharm Sci View, you could use figure.show() instead.
Almost everything we'll do with the object-oriented approach, you can do with the function-based approach too! However, I prefer the object-oriented approach because I feel the code it produces is clearer.
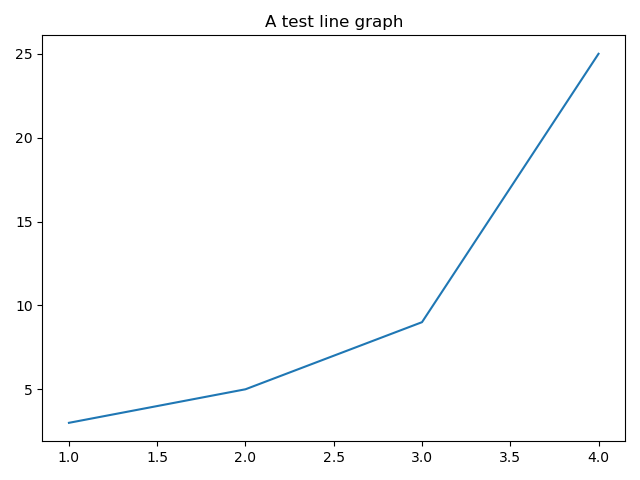
# Setting the Axes title
Every set of axes can have a title displayed above them. We can use .set_title() on the Axes object to achieve this:
import matplotlib.pyplot as plt

figure = plt.figure()
axes = figure.add_subplot()
axes.set_title("A test line graph")
axes.plot([1, 2, 3, 4], [3, 5, 9, 25])
plt.show()
# Setting the x and y labels
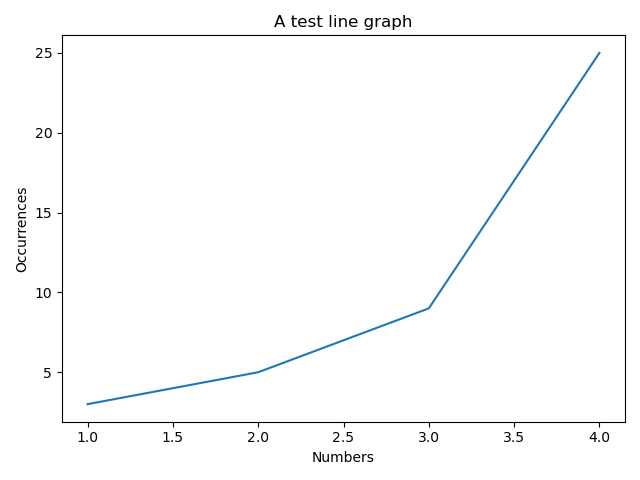
Similarly, we can set x and y labels if we want to be more specific with the data they represent. Here we'll set the x axis label to Numbers and the y axis label to Occurrences:
import matplotlib.pyplot as plt

figure = plt.figure()
axes = figure.add_subplot()
axes.set_title("A test line graph")
axes.set_xlabel("Numbers")
axes.set_ylabel("Occurrences")
axes.plot([1, 2, 3, 4], [3, 5, 9, 25])
plt.show()