# How to export one image with multiple plots with matplotlib
Just as we did previously to create multiple plots using add_subplot(), we can export the finalised figure after:
import matplotlib.pyplot as plt

figure = plt.figure()
ax1 = figure.add_subplot(1, 2, 1)
ax2 = figure.add_subplot(1, 2, 2)

ax1.plot([1, 2, 3, 4], [3, 7, 11, 23])
ax2.plot([1, 2, 3, 4], [5, 9, 17, 25])

figure.savefig("graphs.png")
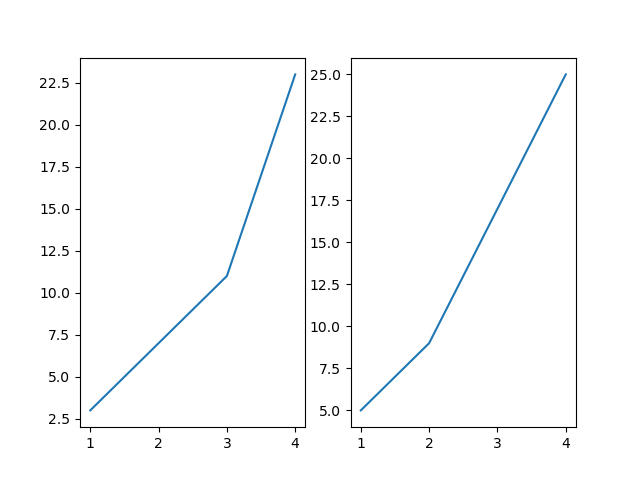
This produces simple output using the default subplots_adjust() configuration:

We can adjust the spacing between plots using subplots_adjust():
import matplotlib.pyplot as plt

figure = plt.figure()
figure.subplots_adjust(wspace=0.5)
ax1 = figure.add_subplot(1, 2, 1)
ax2 = figure.add_subplot(1, 2, 2)

ax1.plot([1, 2, 3, 4], [3, 7, 11, 23])
ax2.plot([1, 2, 3, 4], [5, 9, 17, 25])

figure.savefig("graphs.png")
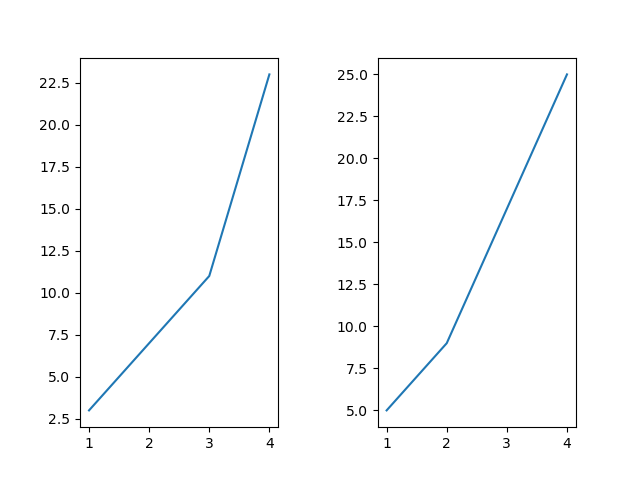
Now the axes are separated by 50% of the average x axis width:

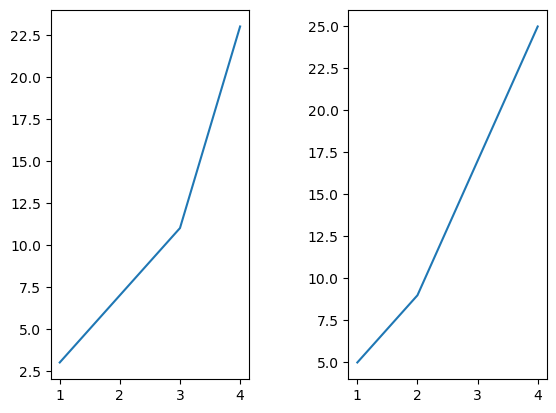
We can set bbox_inches="tight" to constrain the plots as tightly as possible (while still leaving the configured wspace). Remember the default padding around the side of the figure is 0.1:
import matplotlib.pyplot as plt

figure = plt.figure()
figure.subplots_adjust(wspace=0.5)
ax1 = figure.add_subplot(1, 2, 1)
ax2 = figure.add_subplot(1, 2, 2)

ax1.plot([1, 2, 3, 4], [3, 7, 11, 23])
ax2.plot([1, 2, 3, 4], [5, 9, 17, 25])

figure.savefig("graphs.png", bbox_inches="tight")
This shrinks the borders around the axes:

# Recap
To recap, the .savefig() arguments change the size of the figure. You can set it to constrain the plots inside it, and you can also add padding.
The subplots_adjust() arguments change each of the plot settings.