# How to export an image with matplotlib
Instead of figure.show() you can use figure.savefig("graph.png") (or any other filename!) to create an image file.
There's a couple things you can add as arguments to .savefig():
facecolorandedgecolorallow us to set the colour of the main figure or of the edges around the figure. Default to"white".bbox_inchesallows us to set the size of the figure that we want to save. By default it uses the calculated bounding box of the figure. We can set it to a number, in inches, or most commonly to"tight"to calculate the size of the figure before exporting the image.pad_inchesallows us to pass in a padding around the figure ifbbox_inchesis set to"tight". By default it's0.1.
# bbox_inches and pad_inches comparison
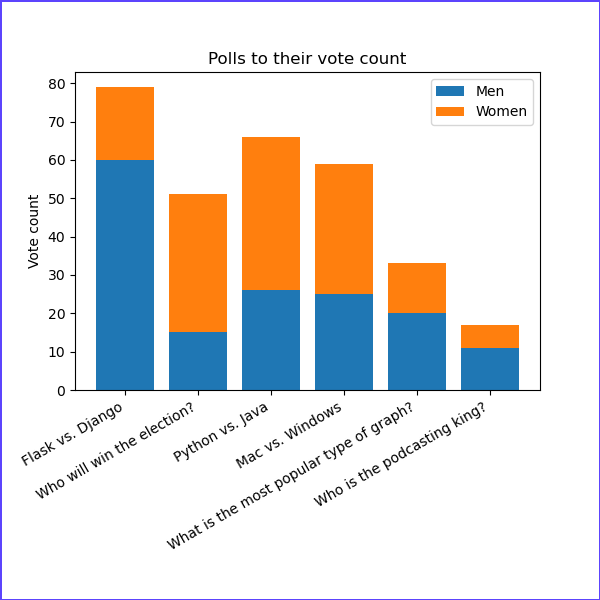
Without bbox_inches and pad_inches, the is exported with its calculated bounding box. This makes use of subplots_adjust() and the figsize argument:
figure = plt.figure((figsize=(6,6))
figure.subplots_adjust(bottom=0.1)

...

figure.savefig("graph.png")
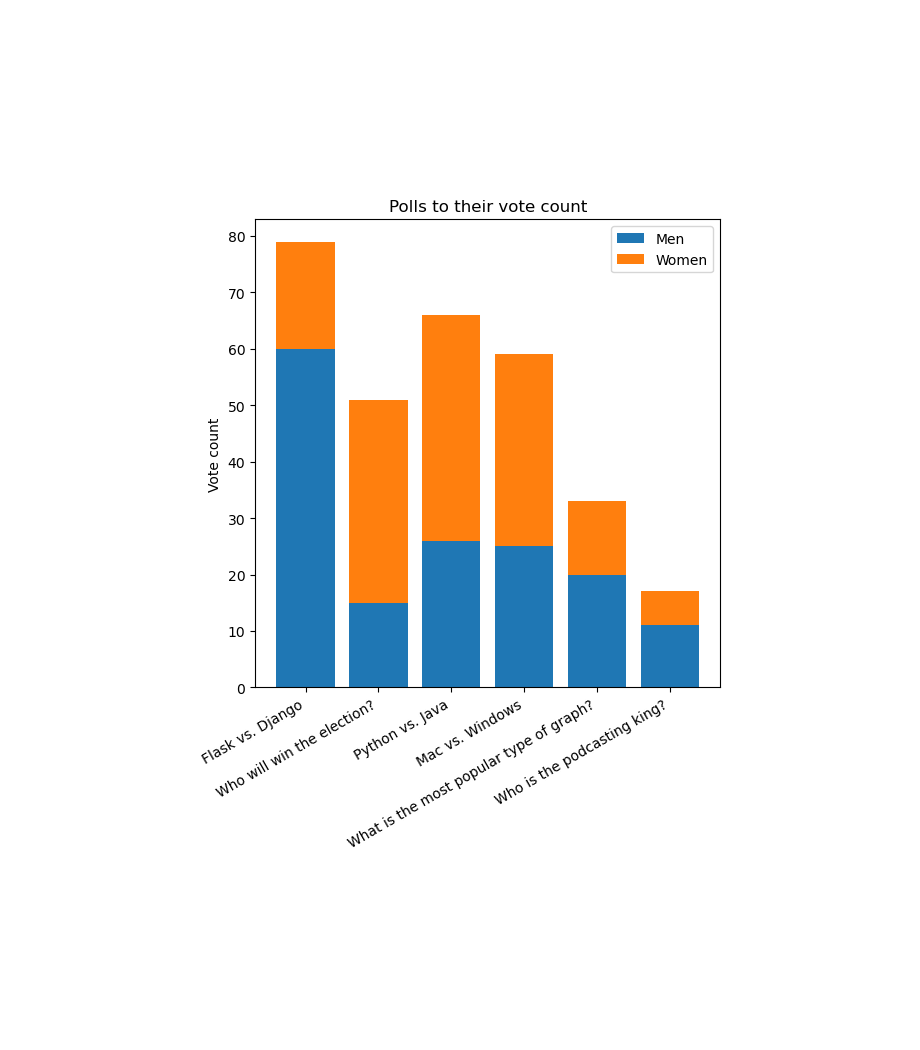
You can alternatively set bbox_inches="tight" and pad_inches to a number, and then the bounding box will be calculated before exporting.
The exported image may be bigger than the figsize to accommodate for axes that would normally be clipped:
figure = plt.figure((figsize=(6, 6))
figure.subplots_adjust(bottom=0.1)

...

figure.savefig("graph.png", bbox_inches="tight", pad_inches=2)
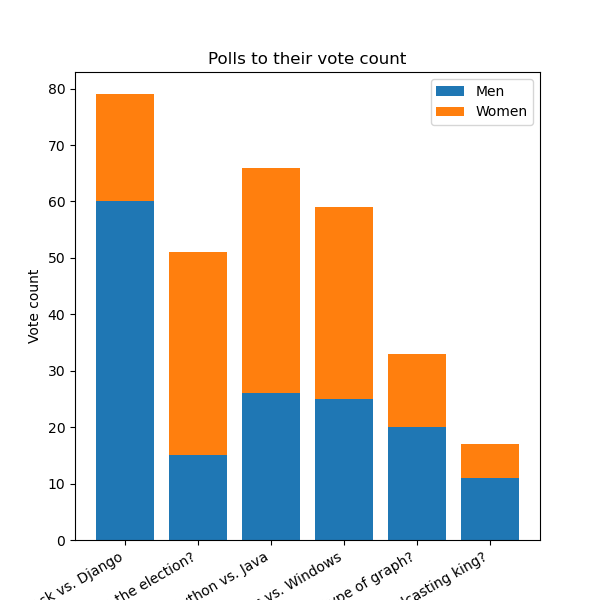
Note the pad_inches is quite large. Skipping pad_inches but still setting bbox_inches="tight" will still calculate the bounding box, but use the default padding value which is 0.1:
figure = plt.figure((figsize=(6, 6))
figure.subplots_adjust(bottom=0.1)

...

figure.savefig("graph.png", bbox_inches="tight")
# facecolor and edgecolor comparison
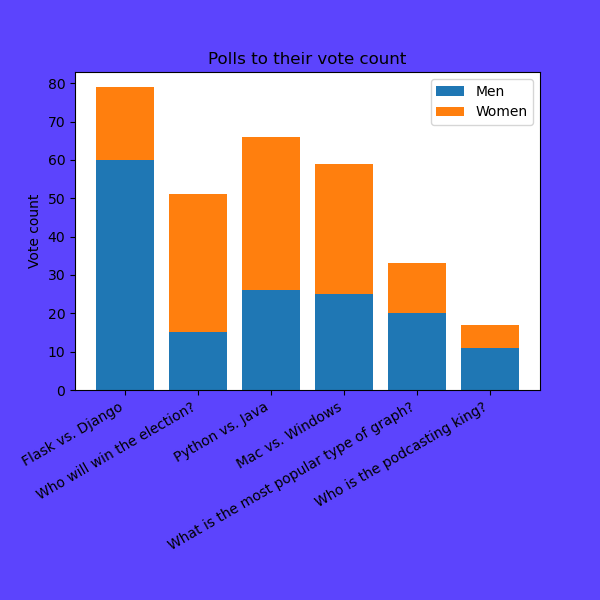
# facecolor
Produced with figure.savefig("graph.png", facecolor="#5c44fd")
# edgecolor
Produced with figure.savefig("graph.png", edgecolor="#5c44fd").
The edgecolor property is the colour of the border. By default figures have no borders, so this won't be visible unless a border is set with figure = plt.figure(linewidth=5):