# How to add multiple subplots to a figure
We've learned that a Figure can contain multiple sets of Axes, each with their own plots.
The documentation often calls a set of Axes a "subplot".
Hence, a Figure can contain multiple subplots:
import matplotlib.pyplot as plt

figure = plt.figure()
ax1 = figure.add_subplot()
ax2 = figure.add_subplot()

ax1.plot([1, 2, 3, 4], [3, 5, 9, 25])
ax2.plot([1, 2, 3, 4], [5, 7, 11, 17])

plt.show()
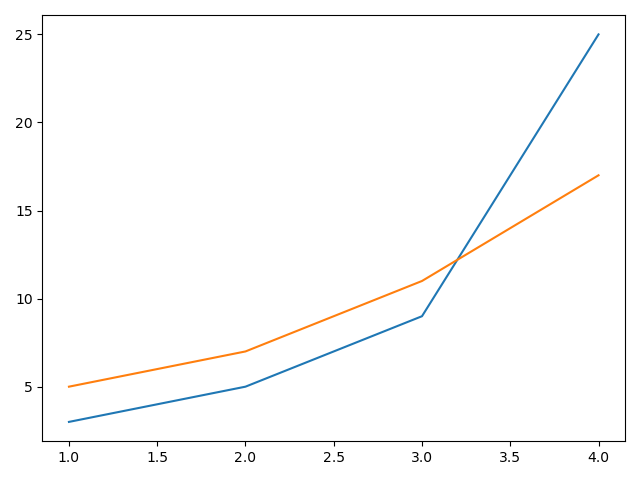
This code looks like it creates two subplots within the Figure object, but actually if we run the code, we see this:

The reason for that is that when we call .add_subplot(), we need to specify the location of the subplot within the figure.
The location of each suplot is specified as three numbers: (nrows, ncols, index).
nrowsdetermines the number of rows in the figure.ncolsdetermines the number of columns in the figure.indexplaces the newly added subplot in a specific cell.
We can modify the code above to place the two subplots in adjacent cells within one row:
import matplotlib.pyplot as plt

figure = plt.figure()
ax1 = figure.add_subplot(1, 2, 1)
ax2 = figure.add_subplot(1, 2, 2)

ax1.plot([1, 2, 3, 4], [3, 5, 9, 25])
ax2.plot([1, 2, 3, 4], [5, 7, 11, 17])

plt.show()
The first subplot is on (1, 2, 1). This means the figure has 1 row, 2 columns, and this subplot is in cell 1. That's the cell at the top left.
The second subplot is on (1, 2, 2). This keeps the figure unchanged (since the number of rows and columns is the same as before), but places this subplot in cell 2. That's the next cell to the right.
The index value starts at the top left, and moves right row by row as shown by this diagram:
TIP
You'll often see this: figure.add_subplot(111).
Matplotlib allows us to pass a three-number code instead of separating them with commas. I strongly dislike this, and I would recommend avoiding this. However, it's good to know as a lot of people do it!
Also, this doesn't work when the total number of cells is greater than 9.
# Using plt.subplots() as a shorthand
We're doing this very often when working with multiple subplots:
figure = plt.figure()
ax1 = figure.add_subplot(1, 2, 1)
ax2 = figure.add_subplot(1, 2, 2)
So matplotlib has a shorthand that we can use:
figure, (ax1, ax2) = plt.subplots(1, 2)
This creates a figure with 1 row and 2 columns. It returns the figure and a tuple of axes in their usual cell order. Therefore, ax1 is the one at the top left, and ax2 is the next one to its right.
If we did this:
figure, ((ax1, ax2), (ax3, ax4)) = plt.subplots(2, 2)
Then ax1 and ax2 would occupy the two cells in the first row, and ax3 and ax4 would occupy the two cells in the second row.
Note that we have a tuple of tuples when using more than one row!